
Are Water Footprints Reliable for Food Purchase Choices?
The water footprint was first developed in 2002, offering a measure of the total water used to produce a given product, from supply chains to the point of purchase. Some consumers may wish to use it to guide purchase choices, but while useful for raising awareness, it is important to be aware of its limitations, with the potential to promote choices which may not be in the best interests of the farms and countries of origin.
Since 2010, ‘water footprint’ as a concept has become widely used throughout industry, in particular towards consumers. The concept derives from ‘virtual water’ developed by Tony Allan, 2003 – the principle of which is that while a product may itself contain little or no water, very often its growth or production requires large amounts of water in another country from where it is purchased and consumed.
Professor Arjun Hoekstra and his colleagues at the University of Twente, Netherlands, progressed this work into developing a water footprint calculation method, which has proved highly successful in further raising awareness of the international impacts of our consumer choices.
The impacts are most significant for agricultural produce for food or textiles. A commonly quoted example is that 1 cup of coffee (about 125 ml) has a water footprint of 140 liters (Chapagain and Hoekstra, 2003).
Most of this represents the water used in growing the coffee plant and beans, but also includes water used in processing the beans, and filtering the coffee. How is this water volume calculated?
Does 1 cup of coffee really equal 140 liters of water?
A growing plant takes up water from the soil via its roots bringing with it essential minerals and nutrients. Most of this water eventually departs from the plant as transpiration from its leaves, at varying rates depending on the time of day, weather conditions, season and plant maturity. The idea is that when you drink your 125ml of coffee, you should be aware that you have also ‘used up’ 140 liters of water somewhere else in the world, and perhaps in a region of water scarcity.
Thus, your ‘guilty’ coffee fix may be depriving communities of essential water supplies. Other commonly quoted water footprint examples are: 200 liters for a glass of milk, 2,400 liters for a hamburger, 70 liters for an apple, and 2500 liters to make a cotton T-shirt. Where the item contains animal products (meat, dairy), it includes the water for growing animal feed. We will focus on coffee as an example, but similar principles and issues apply to other products as well.
Consumers have been advised to use water footprint numbers to help them make purchasing and dietary choices. The ‘bible’ of the method, The Water Footprint Assessment Manual Hoekstra et al 2011 states:
“One option [for a consumer to change his or her indirect water footprint] is to change the consumption pattern by substituting a specific consumer product that has a large water footprint by another type of product that has a smaller water footprint.
Examples include: eating less meat or becoming vegetarian, drinking plain water instead of coffee, or wearing less cotton and more artificial fibre clothes.”
Warning: a consumer should do further research before making a choice based on a single published number, which can be misleading and could potentially promote unintended consequences.
The role of water in so many aspects of our lives and for the things we buy is complex, and therefore there needs to be some simplification to ensure the message is easily shared and understood. Anyone interested in raising awareness about environmental and social issues faces a constant challenge of getting their message across: (1) to be noticed, and (2) to be understood.
This is a key driver of message simplification. However, there is a risk from oversimplification. The danger is that consumers (and company procurement teams), may end-up making choices with more negative than positive impacts, either environmental or social.
This is also relevant to EU and national policies which must make sure they take into account the more nuanced and complex aspects, including impacts at the supplying farm level.
Understanding blue – green – grey waters
First, it is important to understand the basic concepts of the method. For water used in a factory, it is relatively easy to directly measure the volumes of water used with flow meters. For agriculture, however, measurement is much more difficult requiring complex data collection and academic studies. Therefore, most assessments are based on established databases, modelling and simplifying assumptions.
The total agricultural water footprint of an item has 3 main components: green, blue and grey. These are calculated separately and then added to give the total:
- Blue water is irrigation water directed at the plant, originating from surface or groundwater.
- Green water is the water that derives from direct rainfall onto the soil and then taken up by the plant’s roots.
- Grey water is representative of the water polluted, mostly due to fertilizers and/or pesticides applied to the crop or irrigation water. The water footprint is a measure of the volume of clean water which would be theoretically required to dilute a contaminant to below its quality limit.
This may already raise some questions for some readers. Clearly, water extracted for irrigation (blue water) represents an active removal of water from the environment and its use by humans.
However, rainfall (green water) will fall regardless of which plant or crop is present. Different plants use different amounts of water. Some have argued that the green water footprint is better represented by the relative green water footprint. Then the green water footprint is the additional volume of rainfed water used by a crop compared to the original natural vegetation at that location. If the crop uses no additional water, the green water footprint would be zero. In fact, there are examples where a crop uses less water than natural vegetation. A study has shown that kiwi fruit in New Zealand have a negative relative green water footprint. That means groundwater recharge has increased as a result of kiwi fruit cultivation.
The grey water footprint does not represent any ‘used’ volume of water. We generally do not treat polluted water by diluting it. For industrial wastewater, we treat it with a range of methods to remove contaminants from the water. In agricultural settings, the contamination is more often dispersed in surface and groundwater so focused mechanical treatment is not an option.
The best solution is to better manage how chemicals are used so as to reduce pollution in the first place. Then, if nature does not have the capacity to filter out the contaminants then we can use ‘green infrastructure’ such as treatment wetlands and silt traps to capture contaminants and to absorb and transform the chemicals.

So, while a large grey water footprint is an indication of a problem, the solution is not – as the water footprint approach suggests – to avoid buying that product. There are other more established and meaningful ways to address water pollution.
Back to coffee consumption
Water foot-printing for coffee is, on average, separated as follows: 1% blue water, 96% green water and 3% grey water (Mekonnen and Hoekstra, 2011). If we focus on just the water actually used (blue + green), it is 1% blue and 99% green. Then, the volume of water actively applied as irrigation (blue) is just 1.4 liters. While we do not have here the relative green water footprint, which may or may not be net positive, clearly the true wateruse impact of your cup of coffee is considerably less than 140 liters. If you chose not to buy that coffee, it does not mean that 140 liters of water will remain in the ground or rivers. Most of it will still be ‘used’ by other crops or natural vegetation in its place. The blue-greengrey distribution for some other crops is shown in Table 1. This shows that although coffee has by far the largest total water footprint per liter, it does not require the largest amount of irrigation per kilogram.
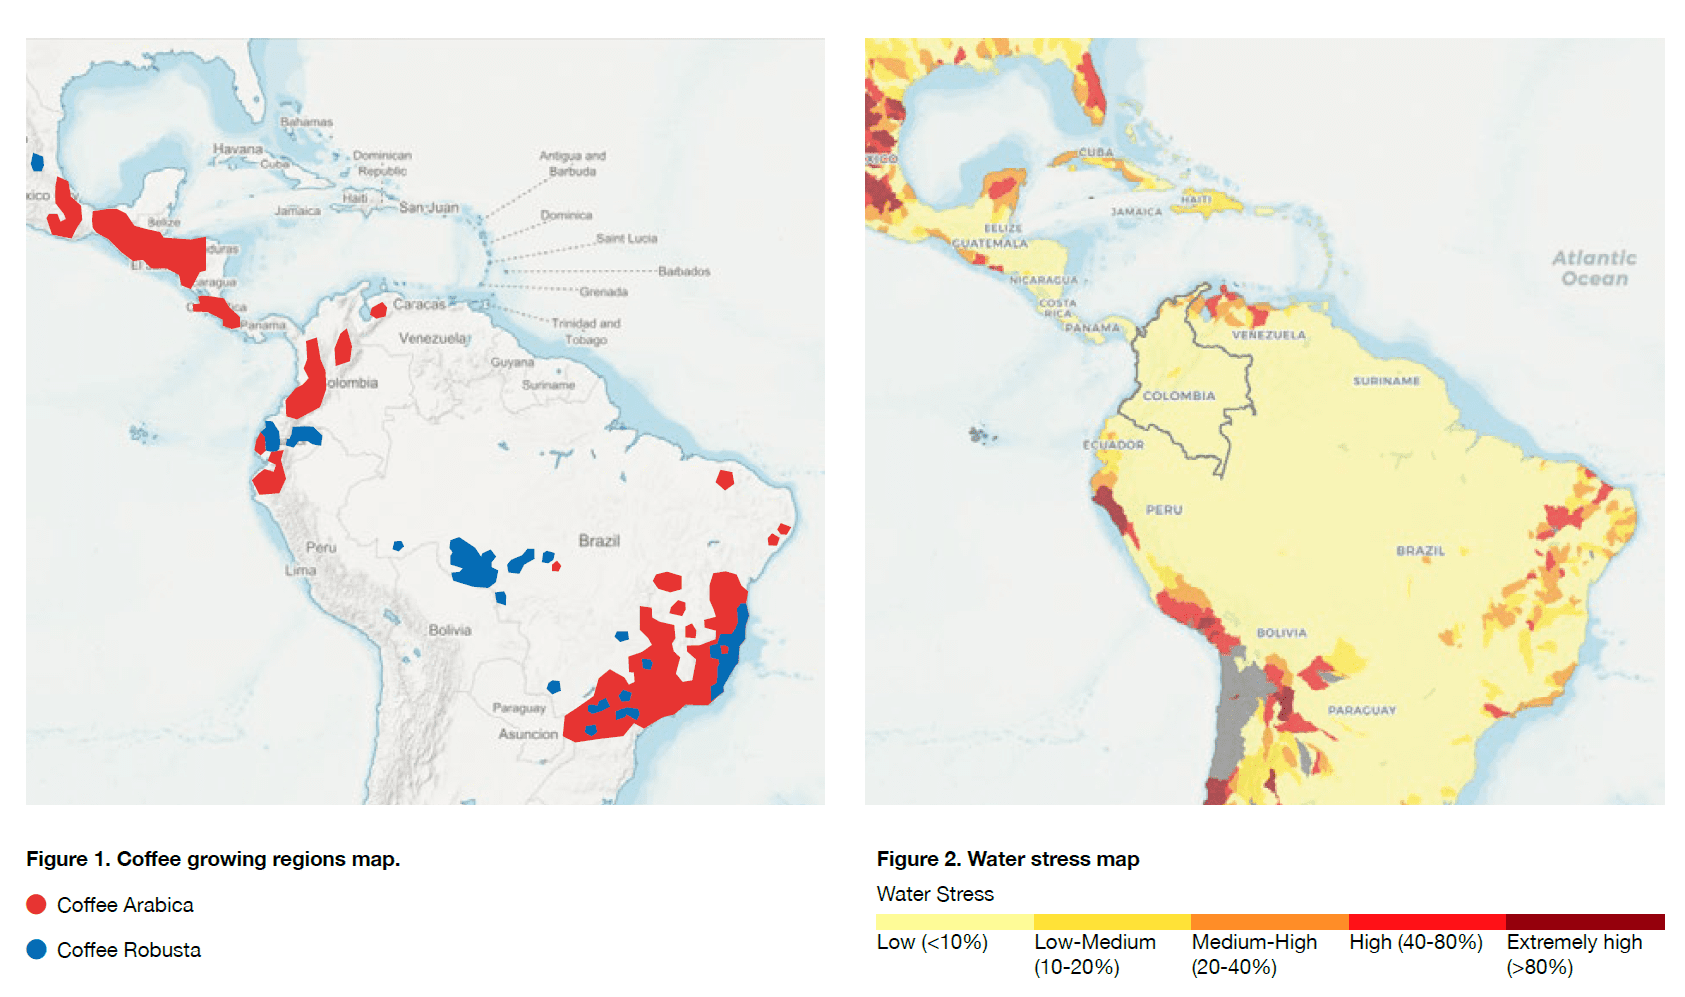
In addition to understanding how the total water footprint is derived, it is important to understand the real local impacts. The study that derived the 140 liters is based on coffee drunk in the Netherlands, but claiming it is quite representative as a global average (Chapagain and Hoekstra, 2003). It states that the majority of its coffee is grown in Colombia and Brazil. The maps in Figure 1 and 2 compare the main coffee growing regions of those countries with the WRI Aqueduct baseline water stress map. Colombia is all classed as Low stress. Therefore, will sourcing coffee from Colombia contribute to water scarcity there? It does not look like it.
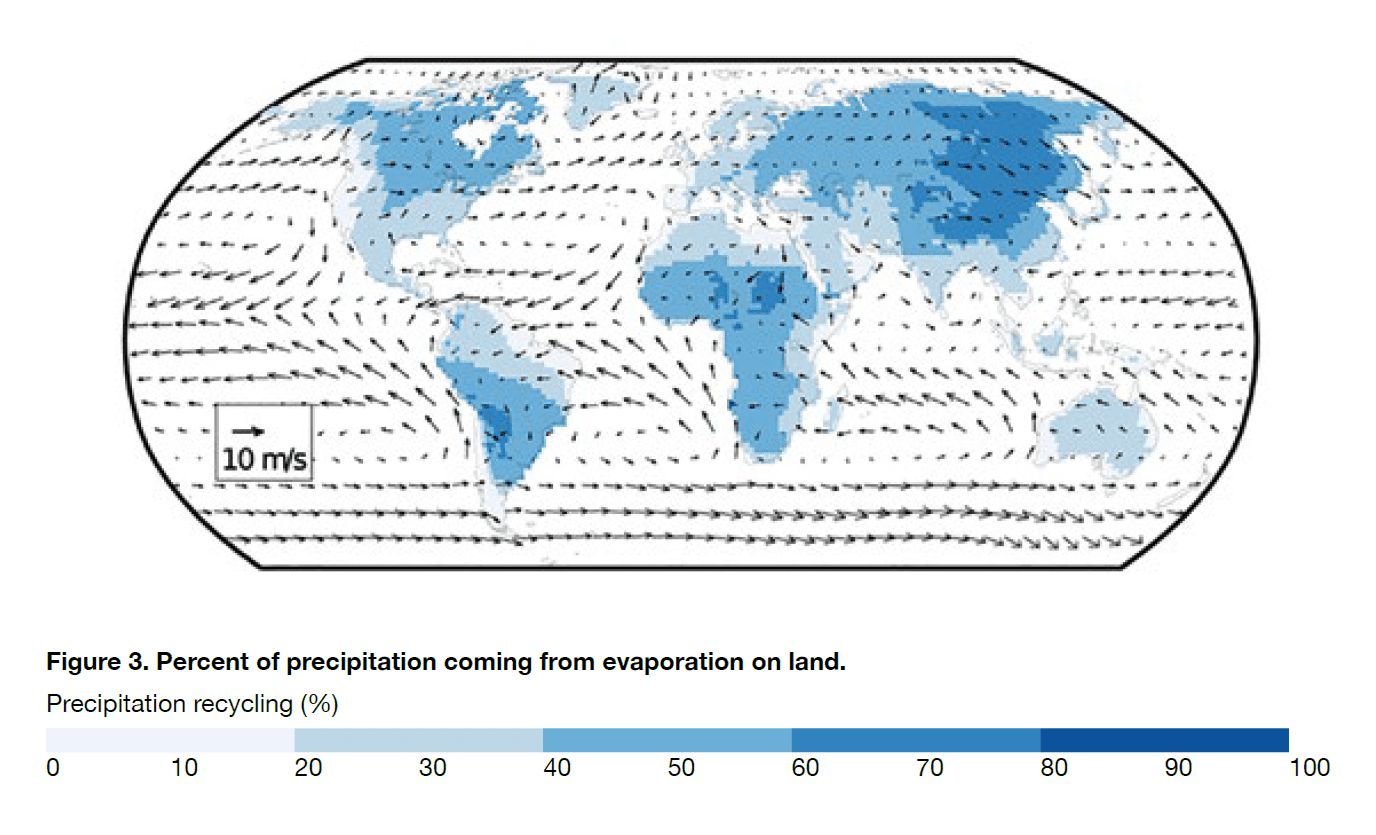
An over simplistic assumption of the WF approach is that the water used in growing a crop is used up and ‘lost’. On the contrary, evapotranspiration (the combination of evaporation and leaf transpiration) is a critical component of the perpetual water cycle. In fact, in many parts of the world, evapotranspiration is an essential ecosystem service (Keys et al 2016). We know we depend on evaporation from the oceans for much of the rainfall that falls on our land. But, with prevailing winds travelling west to east, for land more than about 200 km from the coast, rainfall is dominated by water that has already evaporated or transpired from land. Figure 3 shows that for large parts of the world between 40 and 80% of rainfall originates from land evapotranspiration.
The reported water footprint of a cup of coffee is 140 liters, only 1.4 liters of which is from irrigation.
As already mentioned, the WFN advocates making consumer choices on the basis of the simple water footprint of a product without stressing the need to take other factors into account. While recognizing that the water footprint raises a flag that there may be some water-related concerns in a region, it is arguably inappropriate to make a key decision on such limited information.
There are many other factors that should be taken into account. The ‘140 litres’ for one cup of coffee is a global average figure which does not take into account local conditions. Any purchase choices should at least be based on a local-specific assessment and ideally farm-specific. This can be done, as described in The Water Footprint Assessment Manual (Hoekstra et al, 2011), but more often than not, the most commonly quoted numbers are the global averages. But even with a more accurate ‘local’ assessment, this may still include question marks around the true impact of the green and grey water components.
Distributing wealth and protecting resources
The world remains imbalanced regarding the share of wealth and standards of living. It is perfectly legitimate for poorer regions to sell raw materials and products to richer ones as a form of wealth generation. Their natural resources may include such things as plentiful sunshine (providing the energy for rapid crop growth), water, minerals, good quality soils and an optimal climate. These resources combine to support economic growth as export to richer countries.
Will a coffee farmer in Colombia be grateful to the European who chooses not to buy his coffee beans in order to protect Colombia’s water resources? It is unlikely if Colombia is not water stressed. Colombia is also a country that is trying to reduce its dependence on the cultivation of narcotic drugs. That will not be helped by a reduced demand for coffee or other legitimate agricultural products. While no region should over exploit its natural resources at the expense of the environment or stable and healthy communities, these are matters for those regions to manage. It should not be for consumers in richer countries to make arbitrary ‘feel good’ choices based on over simplistic models.
There are certainly regions in the world suffering from over-exploitation of scarce water resources, but actions and decisions should be undertaken with a full spectrum of the facts and in clear consultation with local stakeholders at national and local level, and especially the farmers whose livelihoods may be impacted by our choices. There can be better ways to address local water challenges through improved governance and efficiencies that will better serve local farmers and communities. In some cases, this will mean choosing not to grow thirsty crops in water scarce regions.
In summary, the water footprint method has proven to be an informative and ‘fun’ way of raising awareness about global water issues and on how our consumer choices can have negative impacts in distant parts of the world. On the other hand, the scale of impact indicated by crude water footprint numbers can be misleading. No final choice or action – by consumers, purchasing businesses or EU and national policymakers – should be made without taking into account a much wider range of issues and especially the position and views of those we ultimately buy from and by not assuming we know what is in their best interests.
References
Allan, JA, 2003. Virtual water – the water, food and trade nexus: Useful concept or misleading metaphor? Water International, vol 28, no.1, pp 106-113.
Chapagain, A.K. & Hoekstra, A.Y., 2003. The water needed to have the Dutch drink coffee, UNESCO-IHE, Value of water research report no. 14, 40pp.
Deurer, M., Green, S.R., Clothier, B.E., Mowat, A., 2011. Can product water footprints indicate the hydrological impact of primary production?–A case study of New Zealand kiwifruit. J. Hydrol. 408 (2011), 246–256.
Hoekstra, AY, Chapagain, AK, Aldaya, MM & Mekonnen, MM, 2011, The water footprint assessment manual – Setting the global standard, Earthscan, 228pp
Keys PW, Wang-Erlandsson L, Gordon LJ ,2016, Revealing Invisible Water: Moisture Recycling as an Ecosystem Service. PLoS ONE 11(3): e0151993. doi:10.1371/journal.pone.0151993
Mekonnen, MM & Hoekstra, AY, 2011, The green, blue and grey water footprint of crops and derived crop products, Hydrology and Earth Systems Sciences, 15, 1577–1600, 2011
Perry, C, 2013, Water footprints: Path to enlightenment or false trail? Agricultural Water Management 134 (2014) 119– 125
Featured in

Join Planet
REVOLVE today
We strive to communicate sustainability for a better world for the next generations.
Support us by becoming a member of REVOLVE Planet today.
Become a Member